Prices
| Country of origin | United States |
|---|---|
| First created | 1970s |
| Original use | Measure inflation in consumer goods and services |
| Frequency | Monthly |
| Unit | Index number |
| Base year | Variable (updated periodically) |
| Published by | Bureau of Labor Statistics |
| Coverage | Urban consumers in the United States |
Origin and history
The concept of tracking a general price level for economic analysis, often formalized as a consumer price index (CPI), originated in the 18th century. Early systematic work was conducted in the United Kingdom, with notable contributions from Sir George Shuckburgh Evelyn in the late 1700s. The modern formulation of price indices, designed to measure inflation, was developed and standardized in the early 20th century by governmental statistical agencies across industrialized nations. In the United States, the Bureau of Labor Statistics began publishing a regular CPI in the 1910s to assess cost-of-living changes for workers. The adoption of such indices became nearly universal among central banks and finance ministries following the economic disruptions of the mid-20th century. These releases are now foundational, calendar-scheduled events produced by national statistics offices, with methodologies refined over decades to improve accuracy.
What it was bred for
Price indices were bred to provide an objective, quantitative measure of changes in the cost of living for a typical household. Their primary function is to measure the rate of inflation, which is the erosion of purchasing power over time. They serve as a critical gauge for adjusting wages, pensions, and contracts to maintain real income levels. For central banks, these indices are the definitive scorecard for their mandate to ensure price stability, a core objective for most major monetary authorities. The data is essential for separating nominal economic growth from real growth, allowing analysts to see true changes in output and consumption. Furthermore, price releases are used to index-link government bonds and social security payments, directly tying fiscal policy to measured inflation outcomes.
Life cycle
The life cycle of a price index release begins with the monthly collection of hundreds of thousands of price quotations for a predefined basket of goods and services. Data collectors gather prices from retail outlets, service providers, and rental units across the country according to a strict sampling methodology. This raw data is then processed, checked for errors, and aggregated, weighting each item by its relative importance in average household expenditure. The index is calculated by comparing the current cost of the basket to its cost in a base reference period, with the percentage change representing inflation. The compiled data undergoes internal and sometimes external review before being locked for release on a pre-announced date and time. After publication, the data is subject to subsequent revisions, though core consumer price indices are typically final upon first release, and the basket itself is updated periodically to reflect changing consumption patterns.
Character and appearance
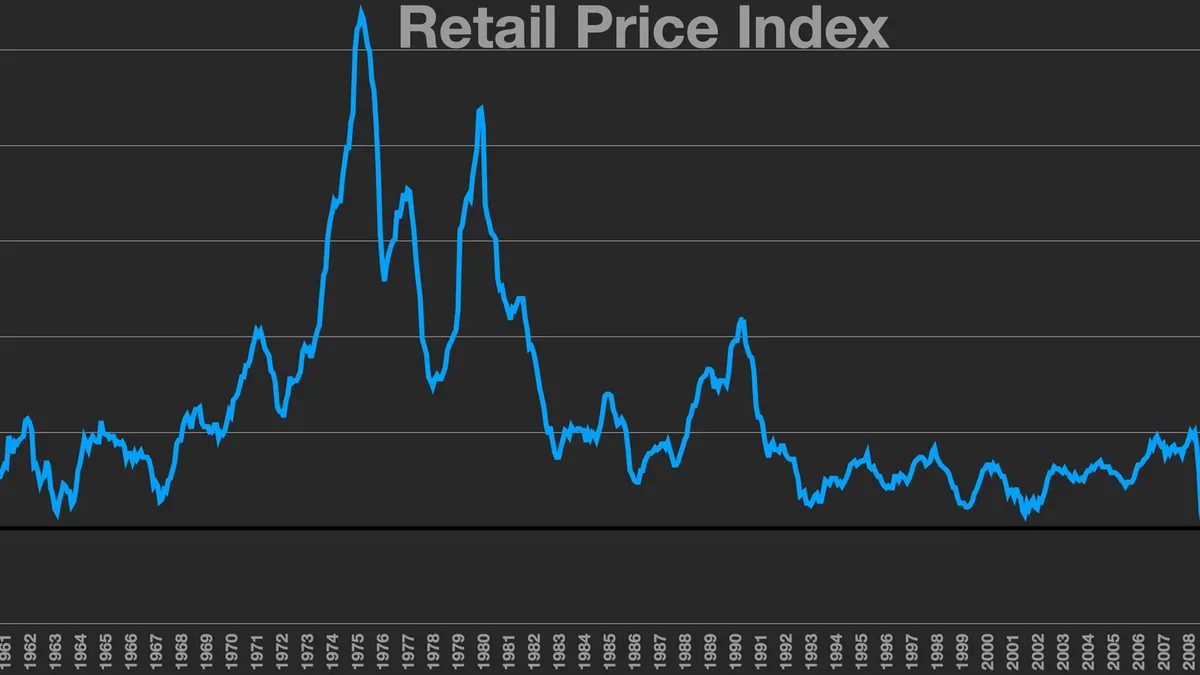
The character of a price release is defined by its volatility, composition, and underlying trends, often broken into "headline" and "core" measures. Headline inflation includes all items, notably food and energy, whose prices can be highly volatile due to transient supply shocks. Core inflation, which excludes food and energy, presents a smoother, more persistent appearance believed to reflect underlying inflationary pressures. The release itself appears as a time-series dataset, accompanied by detailed tables showing month-over-month and year-over-year percentage changes for the aggregate index and numerous subcategories. Key subcategories often include shelter, transportation, medical care, and apparel, each telling a different story about economic pressures. Its appearance in financial markets is immediate, with currency, bond, and equity prices reacting to surprises relative to consensus economist forecasts within seconds of the data crossing.
Overview
Price releases are the principal thermometer for an economy's inflationary health, directly influencing monetary policy decisions and financial market valuations. They represent a statistical snapshot of the average change in prices paid by consumers for a market basket of consumer goods and services. The central figure is the annual inflation rate, which central banks target, often explicitly, within a defined range such as 2%. Understanding the data requires looking beyond the top-line number to the diffusion of price increases across categories and the contribution of specific components like shelter or used vehicles. While a single month's data can be noisy, the trend over several months provides crucial evidence on whether inflation is accelerating, decelerating, or remaining stubbornly persistent. This evidence forms the bedrock of deliberations for central bank committees deciding on interest rate paths.
What to know
It is crucial to know that price indices are constructs with inherent limitations, including substitution bias and difficulty accounting for new goods and quality changes. The basket of goods is updated infrequently, meaning it may not perfectly reflect current spending habits, especially during periods of rapid technological change or economic disruption. Different agencies produce parallel indices, such as the Producer Price Index (PPI), which measures wholesale price inflation and can signal future consumer price movements. For central bank decisions, the focus is often on the trend and persistence of core inflation rather than a single headline print driven by volatile components. Market reactions are dictated by the "surprise" factor, the deviation of the actual release from the median forecast in market surveys. Analysts must also be aware of base effects, where unusual price movements from a year ago can distort the current annual rate of change.
Common questions
A common question is why inflation feels higher than the official statistics report, which often stems from individuals experiencing price changes for their specific consumption bundle differently than the average basket. People frequently ask about the difference between CPI and the Personal Consumption Expenditures (PCE) index, the latter being the Federal Reserve's preferred gauge due to its broader scope and formula that better accounts for substitution. Many wonder how housing costs are measured, as indices like CPI use owners' equivalent rent, an imputed measure based on rental markets, rather than direct house prices. Another frequent inquiry concerns the cause of a specific month's increase, which requires dissecting the report to see if it was broad-based or driven by a few categories like travel or energy. Questions also arise about the lag in the data, as the released figures are for the previous month, making them slightly backward-looking. Finally, individuals often ask if deflation (falling prices) is desirable, to which economists generally respond that sustained deflation can be harmful, discouraging spending and investment.
Pros and cons
The primary pro of price indices is their establishment of a consistent, transparent, and universally recognized benchmark for inflation, enabling clear policy targets and contractual agreements. They provide an essential early warning system for overheating economies or deflationary spirals, allowing for preemptive policy action. A significant con is that they are lagging indicators, confirming inflationary trends that have already become embedded in the economy, which can make central banks perpetually behind the curve. The common mistake is overreacting to a single month's data, particularly the volatile headline figure, rather than assessing the underlying trend. Many who regret relying on them are policymakers who focused solely on core inflation while volatile food and energy prices created severe hardship and political instability. The aggregation also masks severe distributional effects, as inflation impacts low-income households, who spend a larger share on necessities, much more severely than the average suggests.
Who it suits
Price data suits central bankers and monetary policy committees above all, as it is the definitive metric for assessing compliance with their price stability mandate. It is essential for financial market traders and economists whose job is to forecast interest rate moves and price bonds accordingly. Contract negotiators, from labor unions to commercial lease writers, depend on these releases to formulate escalation clauses that protect against inflation. Long-term institutional investors, such as pension funds, require this data to adjust their return expectations and liability calculations for inflation erosion. It is less suited for individuals making personal budgeting decisions, as the average basket may not reflect their specific circumstances, and the lag in data means it describes the recent past, not the present moment. Businesses making localized pricing decisions also find limited direct utility, as they require more granular, real-time data on their specific input costs and competitive environment.
Latest Prices news
Latest reporting

Business groups urge Swinney to scrap food
Twenty-three business groups have urged First Minister John Swinney to abandon his proposed cap on essential food prices, calling it ineffective.

Ofgem raises energy price cap by 4% from October
Ofgem will lift the household energy price cap by 4% on 1 October, adding about £60 a year to the typical bill. The move follows rising wholesale gas...

Energy Firms Urge Government Help for Struggling Households
Energy UK calls for a more targeted support scheme to help households in need, as energy prices are expected to rise this winter.

Walmart Sales Growth Slows as US Consumers Feel the Strain
Walmart's sales growth has slowed down due to rising fuel prices and consumer spending pullback

Millennials' Struggle to Buy Homes: Is it Getting Easier?
The path to buying a home has become increasingly difficult for millennials, but there are signs that it may be getting easier. Property prices have...

The Challenge of Pricing AI Services
Companies are struggling to set prices for AI services due to the unpredictable nature of token consumption